Data is a big part of our lives today. Businesses produce and collect truckloads of data to identify patterns, predict trends, and ultimately make data-driven decisions.
Yet, organizations could have all the valuable data in the world and still lag if their data processing feels like a tedious and horrifying exercise.
Let’s face it, long columns of data can be overwhelming. Plus, you can’t afford the time needed to interpret large datasets in this fast-paced world manually. This is where data visualization tools are crucial.
With the right data visualization tool, businesses can quickly represent raw, complex data in an easy-to-understand manner.
This article discusses data visualization, what makes the right data visualization tool, and a list of the best tools available today.
Table of Contents
What Is Data Visualization?
We are visual creatures. Therefore, the human brain processes visuals way faster than text and numbers. For this reason, data visualization enables the representation of data in a visually compelling manner.
When dealing with complex datasets with hundreds, thousands, or millions of data points, data visualization tools make interpretation and analysis easier. By automating visualizations, businesses can facilitate agile methodology and informed
decision-making.
Data visualization has a lot of use cases. These include anywhere data interpretation is essential, such as:
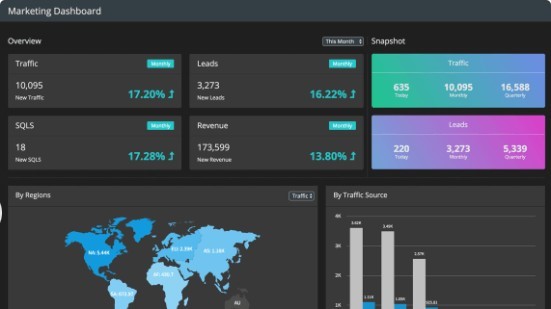
- Marketing dashboards
- Annual reports
- Sales and marketing materials
- Investor slide decks
What Do The Best Data Visualization Tools Have In Common?
The best things in life are in common — they satisfy users’ needs. While data visualization needs can be specific to individuals or organizations, the best data visualization tools provide users with all they need to achieve their goals.
Ease of Use
Regardless of a data visualization tool’s capabilities, it isn’t good if it’s challenging to use. There are many powerful and sophisticated data visualization tools.
Some have great user interfaces and provide seamless user experiences alongside great resources that make them feel intuitive to the user. Others are complicated to understand. Hence, their absence from any “best tools” lists.
Large Datasets
The best tools can easily represent significant and complex data sets. After all, that’s the purpose of data visualization. Great tools allow users to represent multiple datasets in a single view.
Extensive Chart Library
The best tools have extensive charts, graphs, and maps libraries. This reaffirms the notion that great tools provide all you need to succeed. The tools in our list of best tools can represent data in almost any visualization you want.
However, there are some exceptions, as some tools specialize in specific charts or map types and do so exceptionally.
Cost And Package Pricing
This characteristic is relative to your resources. While saving cost is a perk of data visualization, a high price tag doesn’t mean a tool is terrible. However, the best tool matches your budget and justifies its price tag in terms of overall value.
What Are The Best Data Visualization Tools?
1. FusionCharts
FusionCharts is one of the few data visualization tools that meet all the requirements. With a compelling and easy-to-navigate user interface alongside its comprehensive documentation, FusionCharts is easy to use.
Its extensive chart library consists of over 2000+ options you can choose from to visualize virtually any data type. Moreover, you can easily integrate FusionCharts into your project, regardless of your framework. This tool supports Java, Django, Angular, Svelte, and many others. Some of its additional features include:
- Consistent APIs
- Browser Compatibility
- Cross-platform
- Customizability.

2. Tableau
Tableau lets you create interactive graphs, charts, and maps. This tool can connect to various data sources and quickly produce visuals. Additionally, it allows team members to collaborate on projects and implement real-time changes.
The Tableau Desktop is designed to produce static visualizations for web applications. This product does not allow the creation of interactive maps.
This data visualization tool provides easy-to-access documentation and other valuable resources that make it easy to use. Some additional features include:
- Tableau dashboards
- Robust security
- Mobile view.

3. QlikView
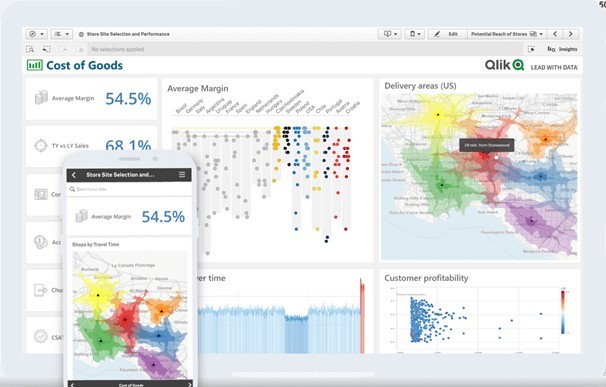
QlikView is a unique tool for visualizing different data types. Its unique ability to accelerate real-time analytics and provide business insights, thereby speeding up and informing decision-making processes.
For many years, enterprises worldwide have used their user-friendly software development kit to create useful visualizations. For example, it can integrate different data sources to produce bar charts, maps, color-coded tables, and more.

Its drag-and-drop user interface makes it easy to use, even for users without coding experience. Moreover, this feature also makes it easy to drag and drop data from data sources, such as spreadsheets.
4. Datawrapper
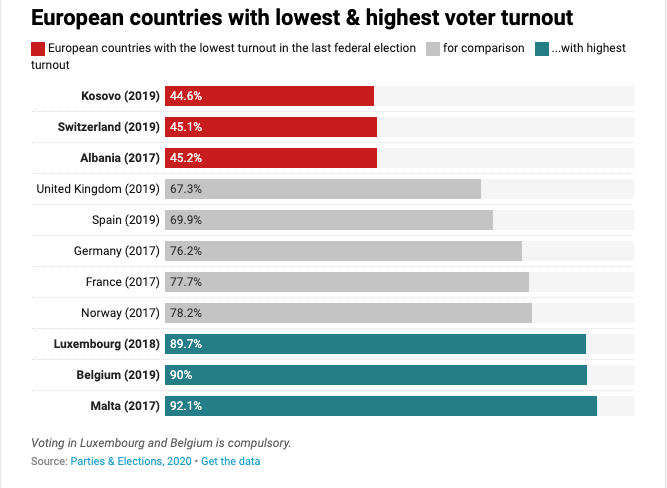
Initially developed for adding visualization to news stories, Datawrapper has become a widely used data visualization tool today. It allows users to create interactive charts and maps to represent news data. Its primary approach for inputting data is “copy and paste.”

Its single-click feature makes it one of the best quick data interpretation and representation options. Some of its popular modes of data visualization include:
- Choropleth and symbol maps
- Column
- Line
- Bar charts
- Election donuts
- Area charts
- Scatter plots
- Locator maps.
If you’re familiar with the visualizations on the New York Times website, you have an idea of what data visualization with Datawrapper looks like.
5. Plotly
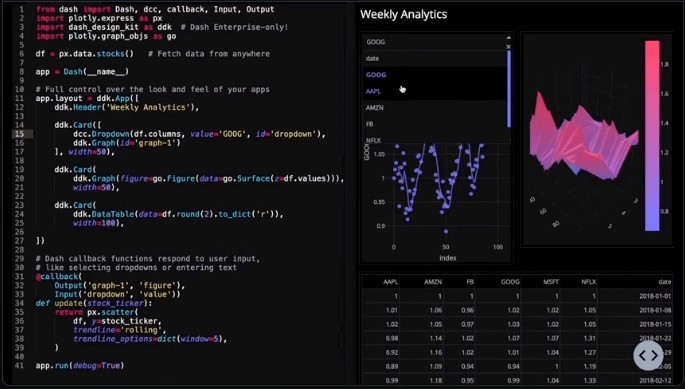
While Plotly is a great tool for visualizing large datasets, what makes it unique is its interactivity and ease of use. It provides a unique URL for your chart, graph, or map. You can use this URL to share your visualizations via blogs or social media platforms.
Another cool feature is its use for educational purposes. By hovering over the data points and examining information about them, readers can understand how you built your charts. This is ideal, as users don’t need to figure out how to decipher your code.
Moreover, Plotly’s extensive library of open-source visualizations makes it great for situations where quick data representation is critical.

Which Data Visualization Tool Should You Use?
There are so many data visualization tools that choosing the best for your project can get overwhelming. So while we’ve provided a list of some of the best tools, you must keep your project needs alongside cost, ease of use, and chart library in mind.
A sophisticated tool with numerous features might only sometimes be the best. Ensure your choice matches your project needs.